Production efficiency
Mass Balance in Food Manufacturing: Calculation and Application
Make actual yield visible by reconciling inputs, outputs, stock changes, evaporation, by-products, rework and losses within the same boundary.
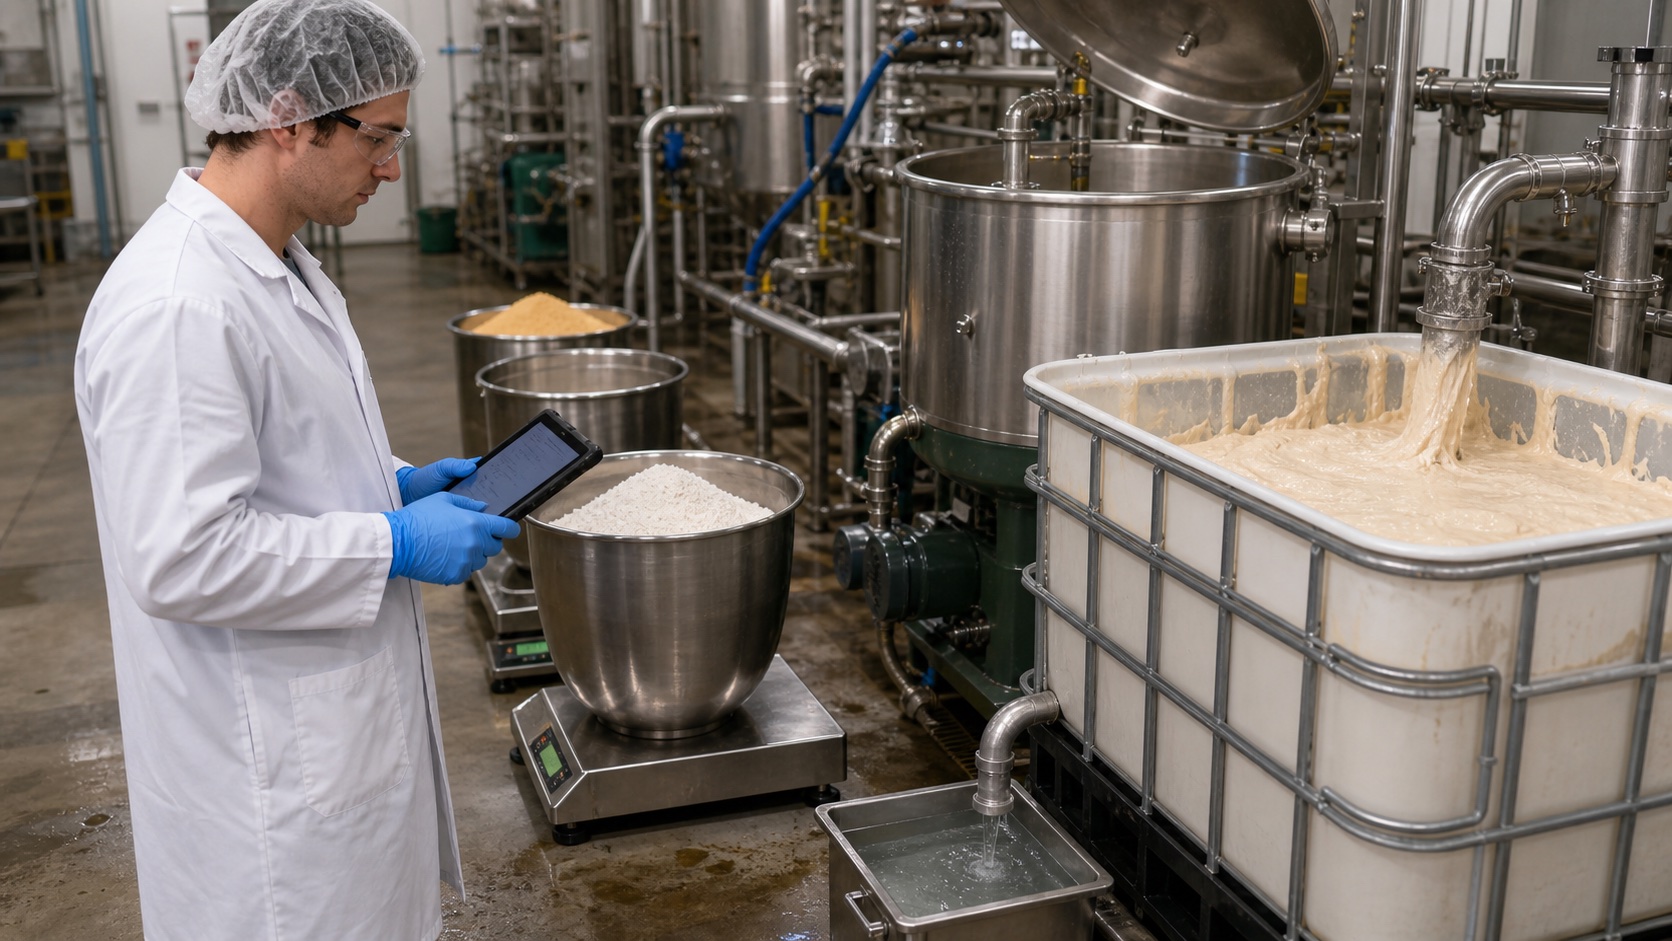
Key takeaways from this guide
- A clear system boundary and common time period are the first requirements for a valid balance.
- Alongside total mass balance, balances for water, dry matter, fat or an active component can identify the root cause faster.
- Use actual weighing records and lot movements, rather than planned recipe consumption.
- An unexplained difference may arise from measurement, recording, cutoff timing or an actual process loss.
What is mass balance?
Conservation of mass means that mass is neither created from nothing nor disappears within a defined system. In a food process, inputs may include raw materials, water, auxiliary materials and rework. Outputs include finished products, semi-finished products, by-products, waste, samples, spills and evaporation. The difference between opening and closing stock also enters the equation.
Open-access measurement guidance published by FAO and WRAP explains that a mass balance approach comparing theoretical production from purchased inputs with actual production, while accounting for stock changes, can measure food loss at facility level. The approach is meaningful only when conversion ratios and data quality are sufficiently understood.
Inputs + Opening stock = Outputs + Closing stock + Explainable losses + Unexplained difference
System boundary and time cutoff
The same data produces different results under different boundaries. A balance can cover one mixer, one production order, an entire line, a shift, a day or a month. Clearly distinguish intermediate stock inside the boundary from flows leaving it. Product left in a filling tank, for example, is closing stock; product washed down a drain is an output. Recording both as 'loss' hides the root cause.
All sources must use the same time cutoff. If materials consumed during a night shift become production output the next day, a calendar-day balance creates a false difference. Prefer operational boundaries such as production-order closure, tank-emptying time or a physical count. Flag late entries and retrospective corrections in the report.
From total mass to component balance
A total balance shows that a difference exists; a component balance helps narrow down why. Water balance can be tracked in drying and frying, fat and dry matter in fat standardization, soluble solids in concentrates and critical micro-components in fortified products. LibreTexts' openly licensed food-engineering example sets separate water, solids and oil balances for potato frying to calculate product quantity, evaporated water and absorbed oil.
Component concentrations must use the same basis. Check wet-basis, dry-basis, percentage, ppm and density conversions. If a sample result does not represent the batch average, a seemingly precise calculation can lead to the wrong decision. Laboratory uncertainty and weighing tolerances should be reflected in acceptance limits.
A simple production-order example
Consider sauce production using 720 kg of a main raw material, 180 kg of water, 80 kg of oil and 20 kg of spices: total input is 1,000 kg. At the end of filling, the records show 920 kg of saleable product, 24 kg of quality-approved rework, 8 kg of samples and drainage, and 30 kg of calculated evaporation. Another 10 kg remains in the tank and line at the end of the period. The accounted-for total is 992 kg, leaving an unexplained difference of 8 kg.
The unexplained difference is 0.8%. This alone cannot be judged good or bad; compare it with process capability, the measurement system and risk. Investigate scale calibration, unit conversions, time cutoffs, unrecorded rework, line retention and actual spills, in that order. Automatically recording the whole difference as 'loss' conceals data problems.
Unexplained difference rate = Unexplained difference / Total input × 100
Yield, process loss and waste are different metrics
Yield is generally the ratio of accepted product output to the relevant input. Process loss may refer to expected, defined losses, while waste describes material leaving the food chain. A by-product may have economic value; rework returns to subsequent production. Combining these categories in one field distorts both costing and sustainability reporting.
FAO's Food Loss Measurement platform treats quantitative loss measurement as a methodology broader than setting a percentage target. A business should separately code edible-product loss and inedible portions, planned process losses and breakdown-related losses, and recovered by-products and disposed waste. This directs improvement investment to the actual point of loss.
A data model for reliable mass balance
The ideal data source is actual lot consumption linked to the production order. Reception, transfers, dosing, production output, quality rejection, rework, sampling, destruction and shipment should use the same quantity and unit definitions. Where scales or meters are integrated, retain device identity, measurement time and calibration status.
A standard recipe is useful for expected consumption but cannot replace actual consumption. When an operator substitutes a material, leaves part of a bag unused or overdoses an ingredient, the actual movement must be recorded separately. The difference between a version-controlled recipe and actual records is an important indicator of process deviation.
- Material, lot and unit master data
- Production order and recipe version
- Actual weighing or dosing records
- Product, by-product, rework and waste outputs
- Opening and closing intermediate-stock counts
- Conversion parameters such as density, moisture and dry matter
- Measurement device, tolerance and calibration evidence
Root-cause analysis when a difference appears
First distinguish data differences from physical differences. Negative stock, wrong units, duplicate consumption entries, unclosed production orders or incorrect date filters can create differences without physical loss. After these checks, investigate process losses: equipment retention, evaporation, sieving, transport loss, startup and end-of-run transitions, cleaning and sampling.
Analyze trends by product, line, shift, equipment and recipe version. An acceptable average difference may conceal a systematic deviation on one shift. Set control limits using measurement uncertainty and normal process variation, avoiding unnecessary alarms for every small deviation.
A shared indicator for operations, cost and sustainability
Mass balance extends beyond production engineering. Unexplained differences affect inventory value and product cost; excessive losses reduce capacity and energy efficiency; incorrect by-product classification distorts sustainability claims. The same data model can give production, finance, quality and environmental teams different views.
Management reports should present inputs, accepted product, rework, by-products, planned losses, unexplained differences and data delays together, rather than one percentage. Close actions with an owner, target date and verification method. After an improvement, verify that product quality and food safety controls are maintained as well as checking that the difference has fallen.
Compilation sources
- FAO / UNEP / WRAP — Guidance on food waste measurement — Measurement through mass balance
- Food and Agriculture Organization of the United Nations — Food loss measurement — Technical Platform on Food Loss and Waste
- Engineering LibreTexts — Introduction to Biosystems Engineering — Material (Mass) Balance
- Food Loss and Waste Protocol — Food Loss and Waste Accounting and Reporting Standard
- Food and Agriculture Organization of the United Nations — Global Standard to Measure Food Loss and Waste
- European Commission Joint Research Centre — Preventing food waste — material flow analysis and measurement
Related guides
What Is Food Traceability? A Guide to Building an End-to-End System
A practical framework for connecting lots, events and data so you can trace from raw materials to customers, and from customers back to the source, within minutes.
Global Food Safety Standards: Choosing the Right System
Compare Codex, ISO 22000, FSSC 22000, BRCGS, IFS Food, SQF and GFSI in terms of scope, customer expectations and implementation effort.
How to Prepare a HACCP Plan: 12 Steps and 7 Principles
Build a working HACCP system, from prerequisites and process flow diagrams to hazard analysis, CCPs, critical limits, monitoring, verification and records.
Food Allergen Management: A Guide to Preventing Cross-Contact
Build a connected system from suppliers to labels, covering allergen master data, zoning, production sequencing, cleaning validation, rework and change control.